svgHeatmap

The svgHeatmap project is intended to enable easy, quick creation of heatmaps (actually choropleths) using a map in Scalable Vector Graphics (SVG) format, and data in Comma Separated Values (CSV) format.
The hope is that while some care and technical knowledge needs to be put into the initial creation of the SVG map, once this is created it is then trivial to create multiple heatmaps from this single resource.
Features
- Fast
- Live updates - all updates happen in-browser
- Plus...
 |
| Dragable legend |
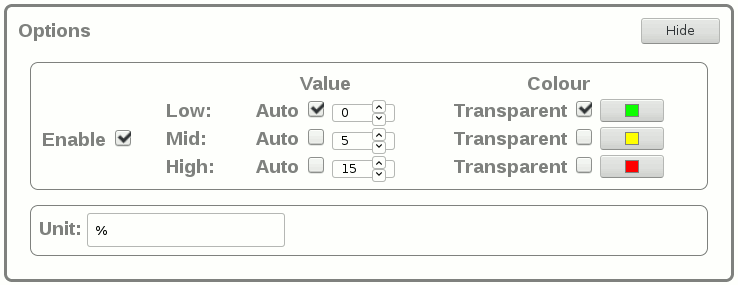 |
| Customisable legend colours and labels |
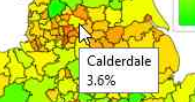 |
| Mouse-over text |
Try it yourself
If you would like to test out the project for yourself, simply download a map and the corresponding example data from your table below and use them here.
Where to get it?
If you just want to use this project to make your own heatmaps you can use the version hosted here. Do note that currently only the Firefox and Chrome browsers work with this project (Edge does not, other browsers are untested).
If you want to host the project yourself, or inspect the source, the project is hosted on Github. I'd welcome any feedback, positive or otherwise. If you have any, Github is currently the place to add it.
How to format the data?
To summarize the svgHeatmap README:
Within the SVG, the regions which are to be programatically
filled must have a unique id. (in Inkscape, press Ctrl-Shift-O
to view/edit this).
From the CSV file, any row of the form
<region name>, <region value>, [<region title>]
will cause any region with id "region name" to be filled
according to the "region value". The third row entry is
optional, but if present will be used in the region title (for
mouse-over text). Empty rows and rows not in this format are
ignored.
Why SVG and CSV?
The reasoning was that both SVG and CSV are common and have good, free, tools for creation and modification. For SVG, see Inkscape, and for CSV use whichever spreadsheet program you have to hand (just remember to select CSV format when saving); I can happily recommend LibreOffice Calc.
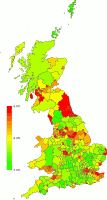
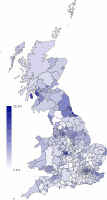
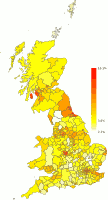
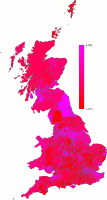
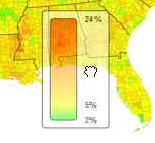
Examples: GB and USA unemployment
For the GB example, I created the svg from OS map boundary data, which took me some time. The USA map was available through wikimedia, and took only a little tweaking. Both of the resulting maps have been uploaded to wikimedia (GB and USA), and should work as they are.
The maps above have the svg regions indexed by official area codes - local authority codes in the case of the GB example and FIPS codes for the USA. This allows easy use of freely available government data.
The GB data was taken from the UK's Office for National Statistics while the USA data was taken from the USA's Bureau of Labor Statistics. A re-ordering of columns was all that was necessary to use the data.


Similar Projects
- flowingdata.com - using python
- www.clearlyandsimply.com - using MS Excel